How To Develop A Blue Ocean Strategy In A Digital Ecosystem
Back in 2002 I developed a 3 dimensional macro/micro framework based strategy for Multex, one of the earliest and leading online providers of financial information services. The result was to sell themselves to Reuters in a transaction that benefited both companies. 1+8 indeed equaled 12. What I proposed to the CEO was simple. Do “this” to grow to a $500m company or sell yourself. After 3-4 weeks of mulling it over, he took a plane to London and sold his company rather than undertake the “this”.
What I didn’t know at the time was that the “this” was a Blue Ocean Strategy (BOS) of creating new demand by connecting previously unconnected qualitative and quantitative information sets around the “state” of user. For example a portfolio manager might be focused on biotech stocks in the morning and make outbound calls to analysts to answer certain questions. Then the PM goes to a chemicals lunch and returns to focus on industrial products in the afternoon, at which point one of the biotech analysts gets back to him. Problem. The PM’s mental and physical “state” or context is gone. Multex had the ability to build a tool that could bring the PM back to his morning “state” in his electronic workplace. Result, faster and better decisions. Greater productivity, possible performance, definite value.
Sounds like a great story, except there was no BOS in 2002. It was invented in 2005. But the second slide of my 60 slide strategy deck to the CEO had this quote from the author’s of BOS, W.Chan Kim and Renee Mauborgne, of INSEAD, the Harvard Business School of Europe:
“Strategic planning based on drawing a picture…produces strategies that instantly illustrate if they will: stand out in the marketplace, are easy to understand and communicate, and ensure that every employee shares a single visual reference point.”
So you could argue that I anticipated the BOS concept to justify my use of 3D frameworks which were meant to illustrate this entirely new playing field for Multex.
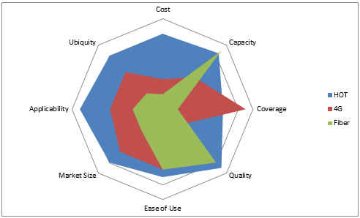
But this piece is less about the InfoStack’s use in business and sports and more about the use of the 4Cs and 4Us of supply and demand as tools within the frameworks to navigate rapidly changing and evolving ecosystems. And we use the BOS graphs postulated by Kim/Mauborgne. The 4Cs and 4Us lets someone introducing a new product, horizontal layer (exchange) or vertical market solution (service integration) figure out optimal product, marketing and pricing strategies and tactics a priori. A good example of this is a BOS I created for a project I am working on in the area of Wifi offload and Hetnet (heterogeneous access networks that can be self-organising) area called HotTowns (HOT). Here’s a picture of it comparing 8 key supply and demand elements across fiber, 4G macro cellular and super saturation offload in a rural community. Note that the "blue area" representing the results of the model can be enhanced on the capacity front by fiber and on the coverage front by 4G.
The same approach can be used to rate mobile operating systems and any other product at a boundary of the infostack or horizontal or vertical solution in the market. We'll do some of that in upcoming pieces.